
Today, lets examine why it’s so important to incorporate the physical activity vital sign (PAVS), sometimes called exercise vital sign (EVS), in the patient’s medical record.
For those who are not familiar with the PAVS, it’s a product of the number of days per week that the patient does moderate-to-vigorous intensity physical activity (or exercise) times the average number of minutes spent doing it each day. Moderate-to-vigorous intensity physical activity is abbreviated as MVPA, so the formula is:
PAVS = (MVPA minutes/day) x (# of days/week)
The US Department of Health and Human Services recommends that all adults should do at least 150 minutes/week of MVPA. An alternative is to do 75 minutes of vigorous intensity physical activy per week.
Examples of moderate intensity activities are - brisk walking, heavy housework, child/elderly care, yard maintenance, leisure or recreational sports.
Examples of vigorous intensity activities are - jogging or running, aerobic dance, competitive sports (soccer, basketball, swimming, etc.), other forms of fitness training, carrying and moving heavy loads, construction, landscaping, etc.
The SHQ calculates a slightly more comprehensive score than the PAVS for the Exercise domain, using the total minutes of both moderate and vigorous activities. The SHQ uses the Exercise score as part of the Overall Risk Score (exercise domain points are subtracted and thus reduce the Overall Risk Score).
Because of the HHS guidelines, obtaining either the PAVS or the SHQ's Exercise score provide actionable information:
• Does the patient achieve the recommended amount of 150 minutes of MVPA / week?
So the PAVS or the Exercise score yield good clinical insight with an individual patient and guide your recommendation, but what about population health?
What is the value of seeing the PAVS or Exercise score of your whole patient population?
Would that help you with meaningful use?
EXAMPLE ANALYSIS OF SHQ DATA
To examine those questions, let’s look at data from 3 employers who used the SHQ in their wellness programs (imagine it's 3 different doctors). In one program, the respondents reviewed their SHQ with their PCP as part of an employer's health plan, in another program the SHQ was used by a hospital for a health fair, and in a third program the SHQ was used as part of an occupational health service at a manufacturing plant. So these data represent a convenience sample of self-reported data, and there is concern about the value of that, but set that concern aside for a moment.
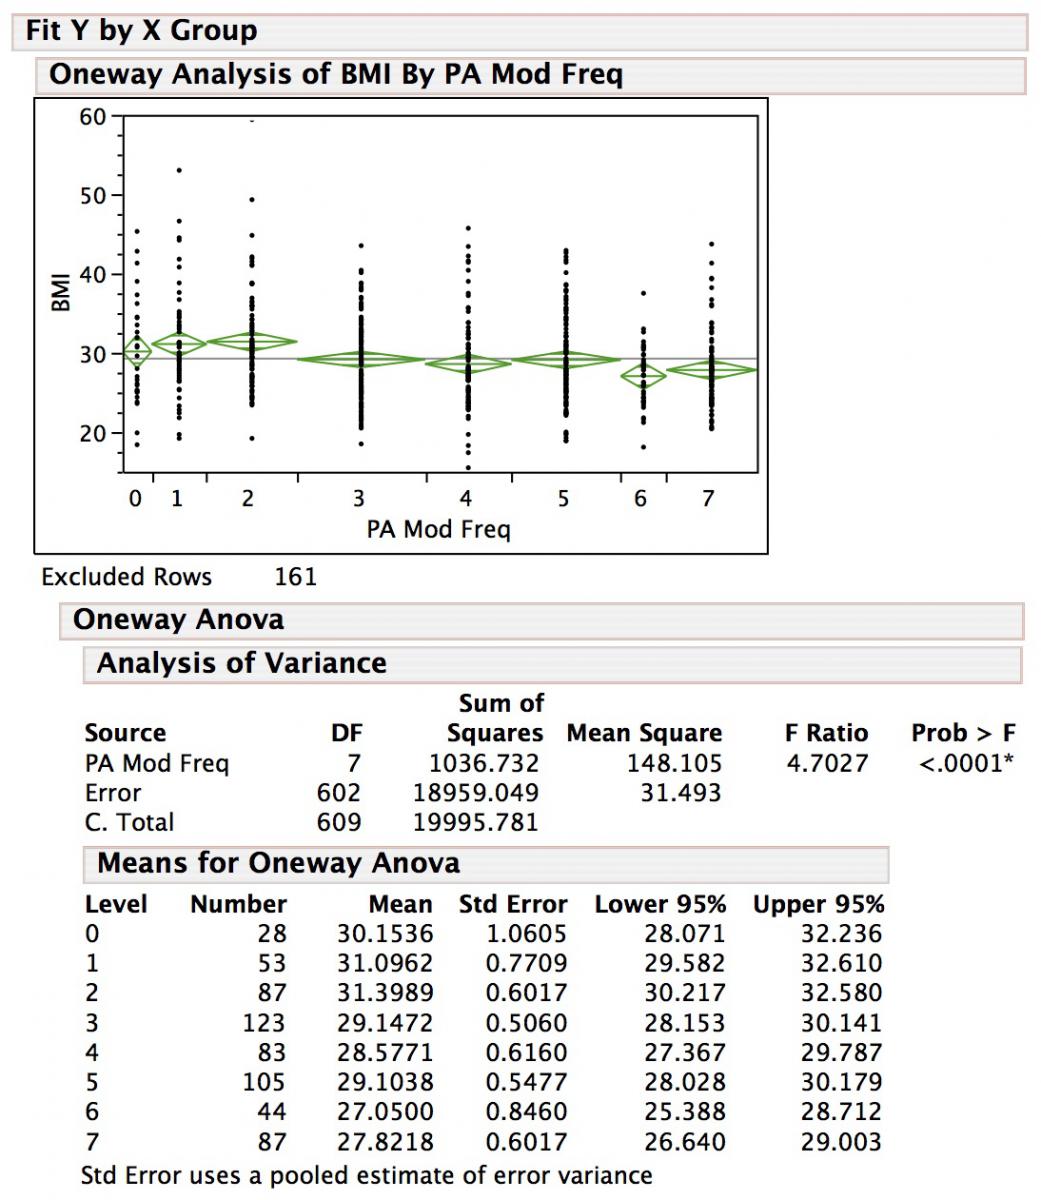
The data shown in figures 1, 2 and 3 are simple univariate analyses of variance (ANOVA) of body mass index (BMI) vs the number of days a week of MVPA. Note that this is not the PAVS or Exercise score, but just the number of days / week of MVPA (I'll explain why). Note that the figures show some questionnaires were excluded from the analysis, because some of the respondents had completed more than one SHQ. In those cases, only the first SHQs were included.
FIGURE 1
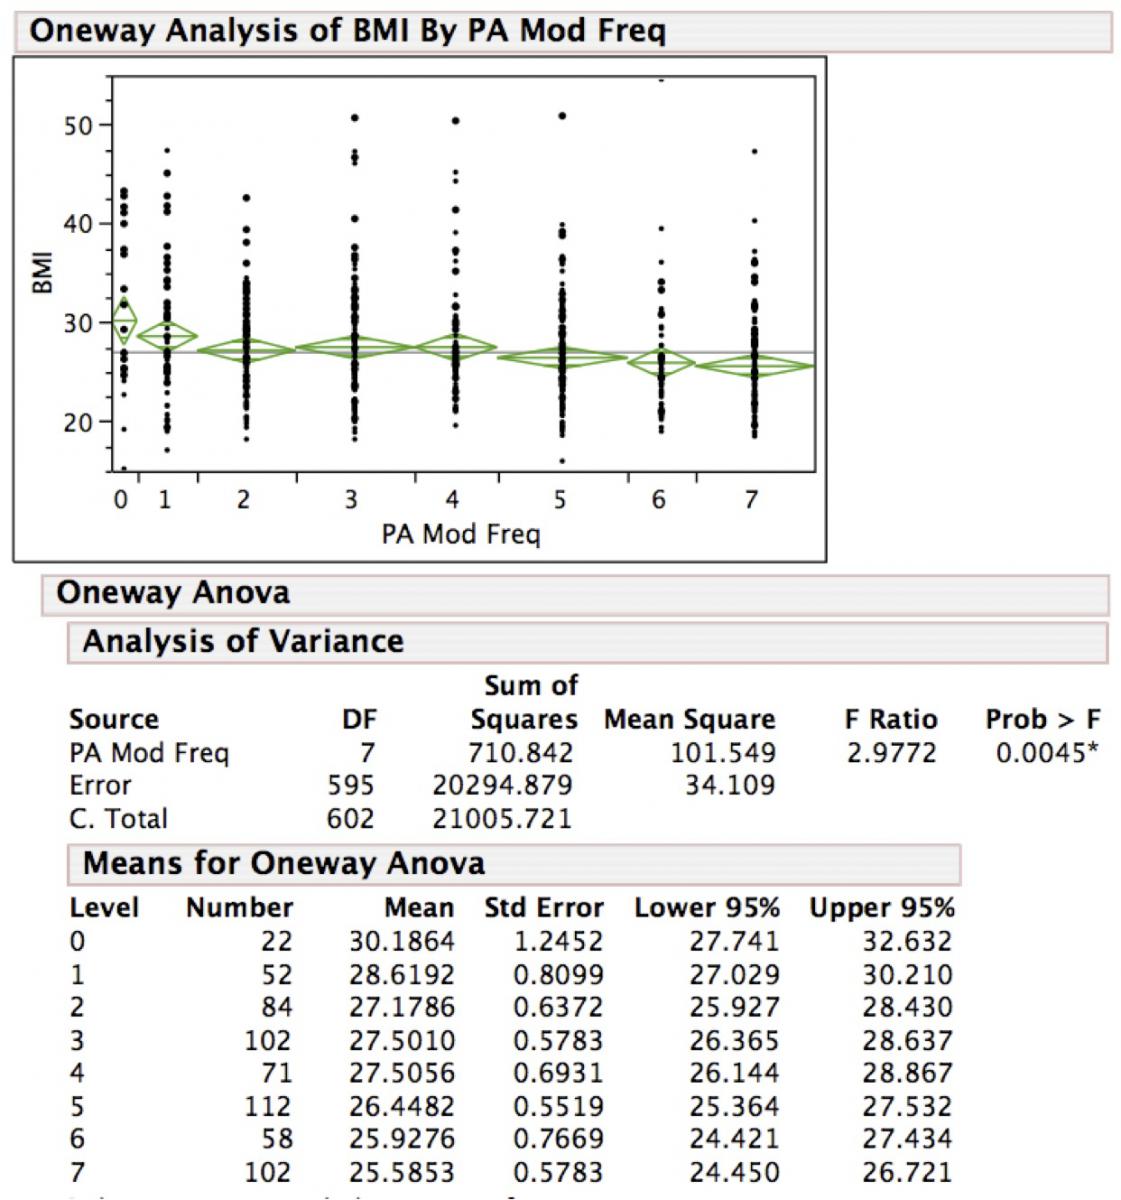
FIGURE 2
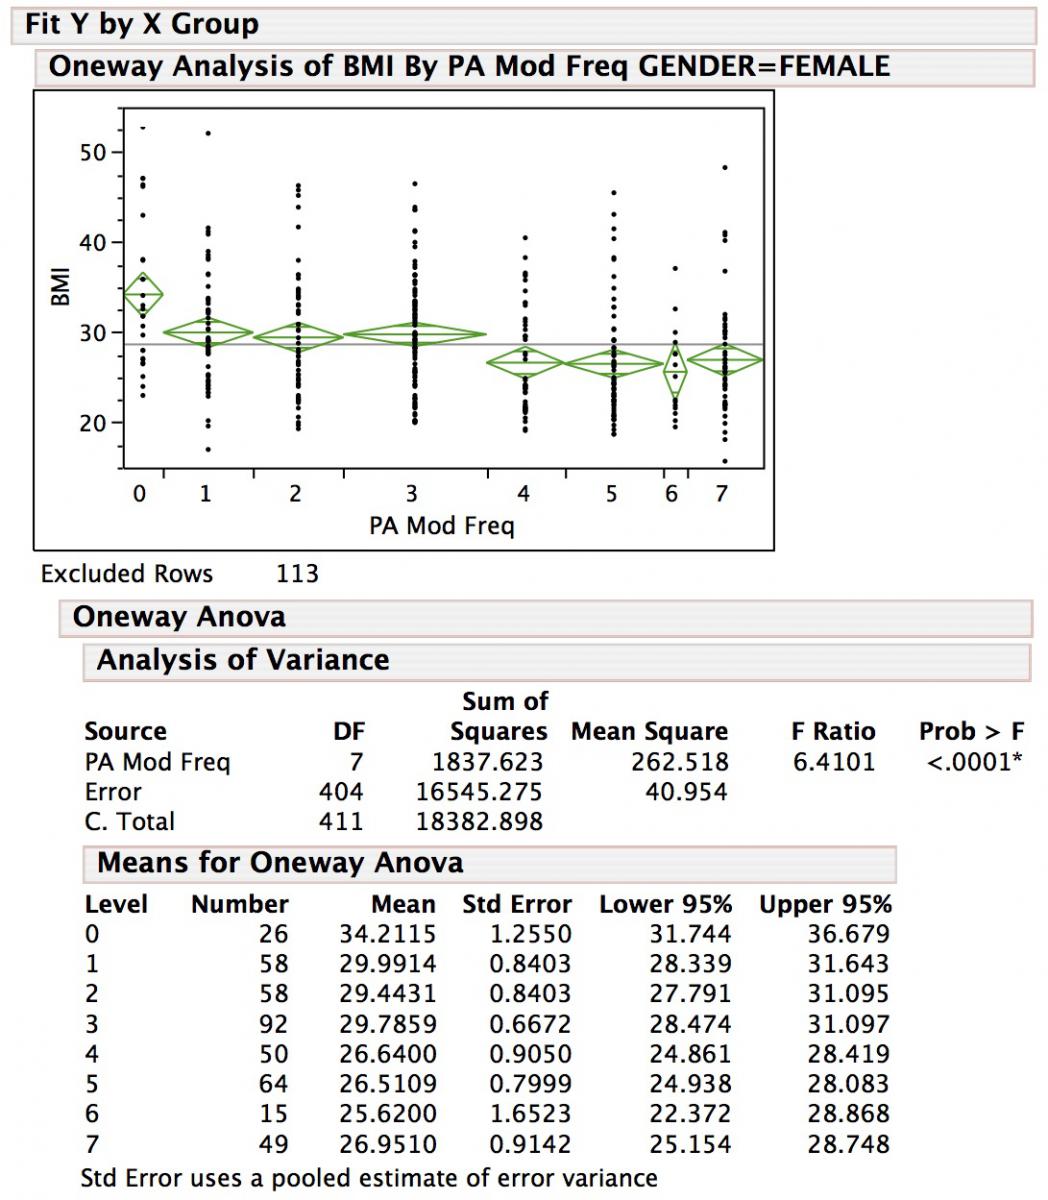
FIGURE 3
HIGHLIGHTS
Consider a few points in these data that are striking.
• On balance, there is a linear inverse relationship between days of MVPA each week and BMI, with some suggestion of slight benefit for doing 1-3 or 4 days per week, additional benefits for doing at least 5 days and - perhaps - the most benefit for doing 6 or 7 days per week,
• Comparing “exercise tee-totalers” (who don’t do any MVPA at all) to those who do MVPA about 5 days a week or more, there is a difference of 4-5 BMI units (nominally ~25 to 30 pounds or ~12-13 kilograms of body weight),
• For each of these populations, the P-values are sufficiently strong to suggest a causal linkage in this relationship, and
• It’s reassuring to see that the questions corroborate the HHS guidelines!!
DISCUSSION
These data suggest that it is useful to quantify the physical activity level of individual patients. That’s important to know, because if someone thinks they don’t do 4-5 days / week of MVPA, they’re probably not meeting the HHS guidelines and are at increased risk for developing weight and physical-inactivity related cardiometabolic conditions such as type 2 diabetes. So if you are going to help that patient avoid such a fate, it’s important to know not only the patient’s weight, but also how much exercise they’re getting.
But, you my ask, why is this presented using number of days of MVPA, rather than the PAVS or Exercise score? Does this relationship hold for the PAVS and Exercise score too?
Yes, the data are very similar in comparing the PAVS or Exercise scores, and if this were a manuscript and not a blog I'd have presented them all!
The reason I presented it this way, however, is to illustrate why my own counseling to patients varies a little bit from the recommendation of 150 minutes / week. My advice is to be active on 5 or more, and preferably all, days of the week (with an aim to do at least 150 minutes). These graphs show why - the BMI is lowest in the people who do 5, 6 or 7 days a week of MVPA. Note that duration of activity isn't even a factor here (though it is reasonable to theorize that the people who exercise every day are likely to exercise longer than those who only exercise 4 or fewer days a week). So by using the present analysis, I've highlighted the importance of having an active lifestyle where physical activity is the norm, where if it's not done every day then it's done on the vast majority of days.
Lastly consider the issue of these data being a convenience sample, in which the number of days of MVPA was self-reported (height and weight were objectively measured by a nurse or medical assistant in all 3 programs). That's just like a practice's patient population. All 3 programs, each with a pretty good sample size of 400-600 respondents, showed the same basic relationship. So either the respondents were consistent in misrepresenting their MVPA, or the self-reported convenience sample really doesn’t matter that much in this situation. Moreover, the strength of the association is so strong that even there are confounding covariates, the number of days of MVPA is a useful way to estimate the activity level in someone's lifestyle.
CONCLUSION
I hope these data persuade you of the importance of quantifying physical activity, even with just a self-report tool, going beyond just asking patients for a qualitative impression of how active they are. One can use the PAVS, though we like our more complete Exercise score in the SHQ. Of course, just knowing the Exercise score is only the first step in a program that improves health, increases quality-of-life and lowers health care costs, but these data show that the SHQ brings tremendous clinically-relevant and actionable information that you need to know about individual patients and your patient population.
RESOURCES AND REFERENCES
The HHS Physical Activity Guidelines
http://www.health.gov/paguidelines/guidelines/summary.aspx
Issue on Physical Activity. The Lancet. July 18, 2012.
http://www.thelancet.com/series/physical-activity
Blair SN. Physical inactivity: the biggest public health problem of the 21st century. Br J Sports Med 2009;43:1-2.
Bravata DM, Smith-Spangler C, Sundaram V, et al. Using Pedometers to Increase Physical Activity and Improve Health: A Systematic Review. JAMA. 007;298(19):2296-2304.
Coleman KJ, Ngor E, Reynolds K et al Initial validation of an exercise "vital sign" in electronic medical records. Medicine & Science in Sports & Exercise 2012; 44(11):2071–2076.
Joy EL, Blair SN, McBride P, Sallis RE. Physical activity counselling in sports medicine: a call to action. Br J Sports Med 2013; 47:49–53.
Sallis RE: Exercise is medicine and physicians need to prescribe it!, British Journal of Sports Medicine, 2009;43:3-4.
Sallis RE. Developing health care systems to support exercise: Exercise as the fifth vital sign. Br J Sports Med. 2011; 45:473-474.
Sui X, LaMonte MJ, Laditka JN, et al. Cardiorespiratory fitness and adiposity as mortality predictors in older adults. JAMA. 2007;298(21):2507-16.
- GE Moore MD's blog
- Log in to post comments
- Follow our Blog